Firm Data
Table of Contents
- Firm Distribution by Size
- Securities Industry Registered Firms by Type of Registration
- Firm Distribution by Number of Branches
- Firm Distribution
- Firm Distribution by Number of Registered Representatives: Additional Breakdown
- 10-Year Change in Number of FINRA-Registered Firms
- Urban-Rural Breakdown of FINRA-Registered Firms and Branches
- FINRA-Registered Firms – Median Number of Years in Business
- Registered Broker-Dealer Firms – Aggregate Financial Information
- FINRA-Registered Firms – Leaving/Entering the Industry
- Spotlight: Capital Acquisition Brokers and Funding Portals
- FINRA-Registered Firm Branch Offices – Opening/Closing
- Advertising Regulation Filing Volumes
- FINRA-Registered Firms – Most Common Marketing Methods
- Advertising Regulation Filing Volumes – Investment Company Product
Firm Distribution by Size, 2014 - 2018 1
(Count as of year-end)
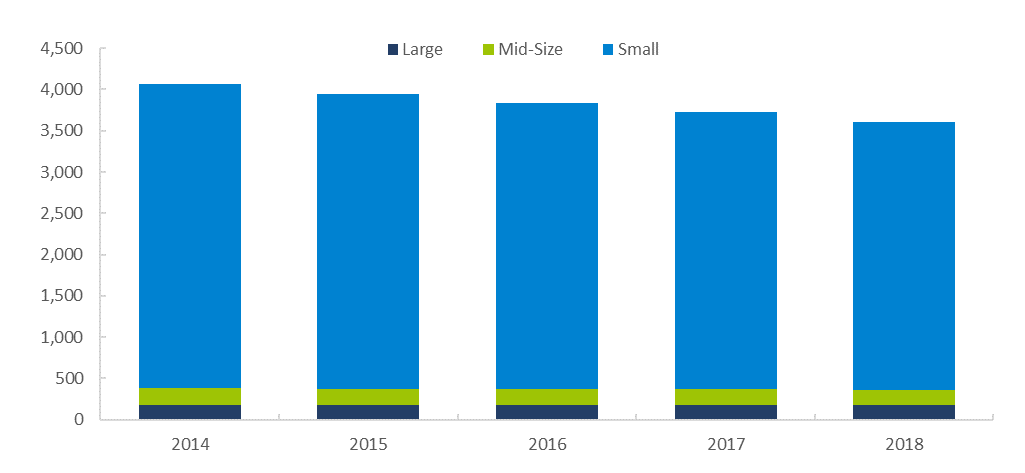
Source: Financial Industry Regulatory Authority
1Large firm = 500 or more registered representatives; Mid-Size firm = 151- 499 registered representatives; Small firm = 1-150 registered representatives.
Securities Industry Registered Firms by Type of Registration, 2009 - 20181
(Count as of year-end)
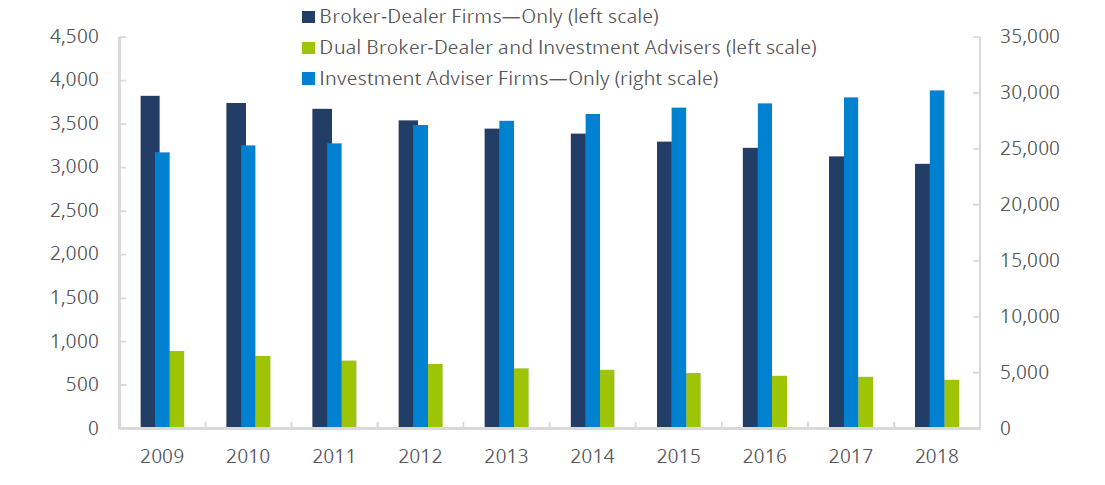
Source: Financial Industry Regulatory Authority
1"Broker-Dealer Firms—Only" refers to firms that are solely registered with FINRA as Broker-Dealers. "Dual Broker-Dealer and Investment-Adviser Firms" refers to FINRA-registered Broker-Dealers who are also registered as investment adviser firms. "Investment Adviser Firms—Only" refers to firms that are registered only as investment advisers and are overseen by the SEC or state regulators.
Distribution of Branches by Firm Size, 2014 ̶ 2018 1,2
(Count as of year-end)
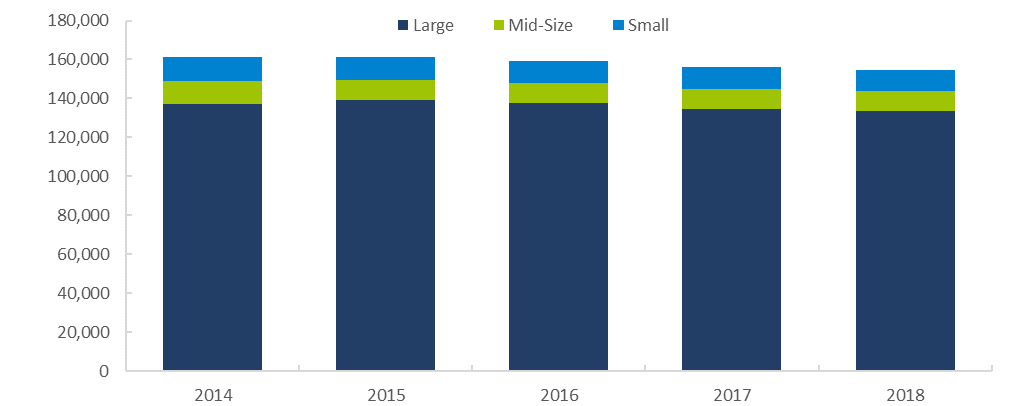
Source: Financial Industry Regulatory Authority
1FINRA-registered firms must register each of their branch offices with FINRA, the New York stock Exchange (NYSE) and states that require branch registration. This is accomplished with Form BR, the Uniform Branch Office Registration Form.
2Large firm = 500 or more registered representatives; Mid-Size firm = 151- 499 registered representatives; Small firm = 1-150 registered representatives.
Firm Distribution, 2018
(As of year-end, percent of total)
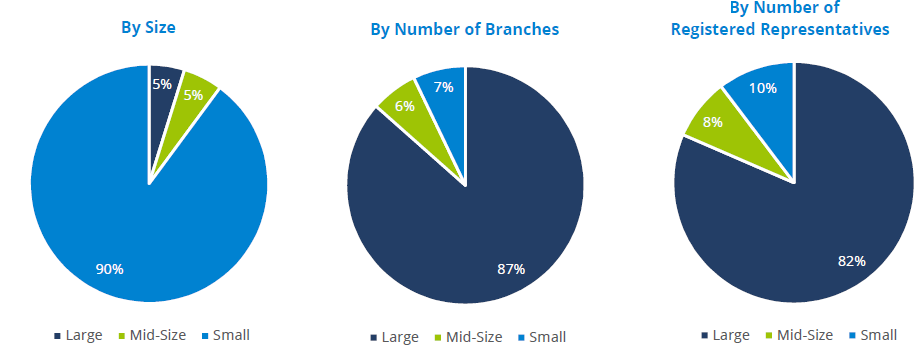
Source: Financial Industry Regulatory Authority
Firm Distribution by Number of Registered Representatives: Additional Breakdown 2018
(Count as of year-end)

Source: Financial Industry Regulatory Authority
10-Year Change in Number of FINRA-Registered Firms, 2008 – 2018
(Count as of year-end)
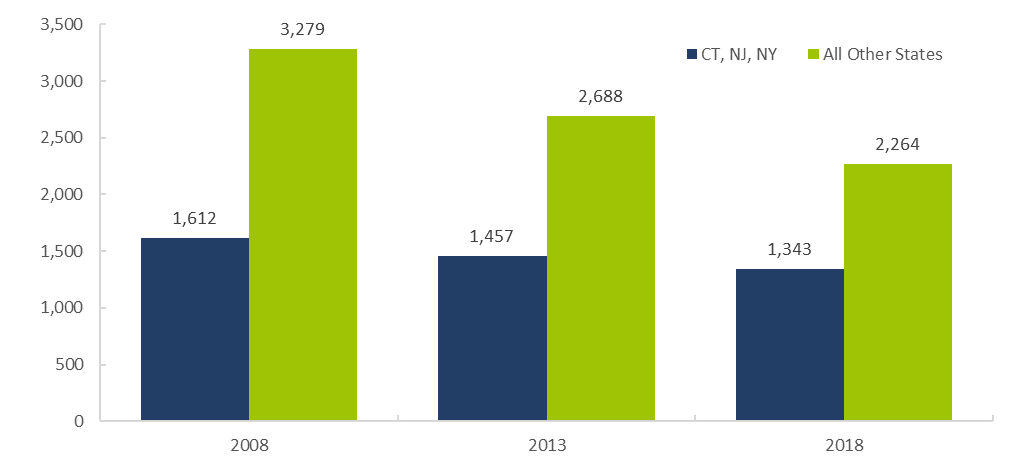
Source: Financial Industry Regulatory Authority
Urban-Rural Breakdown of FINRA-Registered Firms and Branches, 20181, 2
(Count as of year-end)

Source: Financial Industry Regulatory Authority
1Large Firm = 500 or more registered representatives; Mid-Size Firm = 151-400 registered representatives; Small Firm = 1-150 registered representatives.
2Each branch is assigned a corresponding FIPS code based on the ZIP code recorded in CRD. A firm is counted if it has a branch in that area. The U.S. Census Bureau classifies urban counties as counties with less than 50 percent of their population living in rural areas. Counties not classified as urban are defined as rural. In the 2010 U.S. Census, 40 percent of counties were defined as urban counties.
FINRA-Registered Firms – Median Number of Years in Business, 2008 – 2018
(As of year-end)
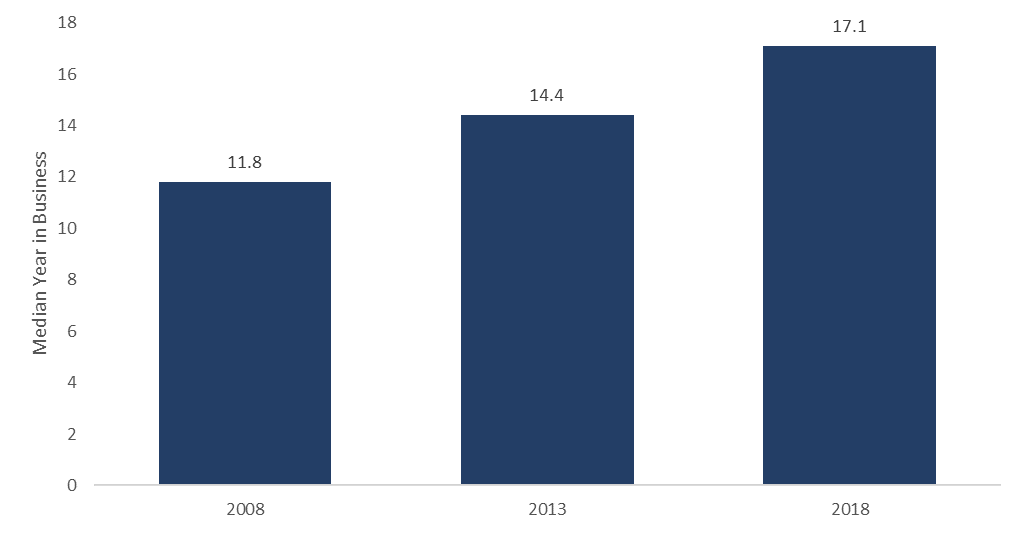
Source: Financial Industry Regulatory Authority
Registered Broker-Dealer Firms – Revenue and Expenses, 2014 – 20181
(In millions of U.S. dollars)
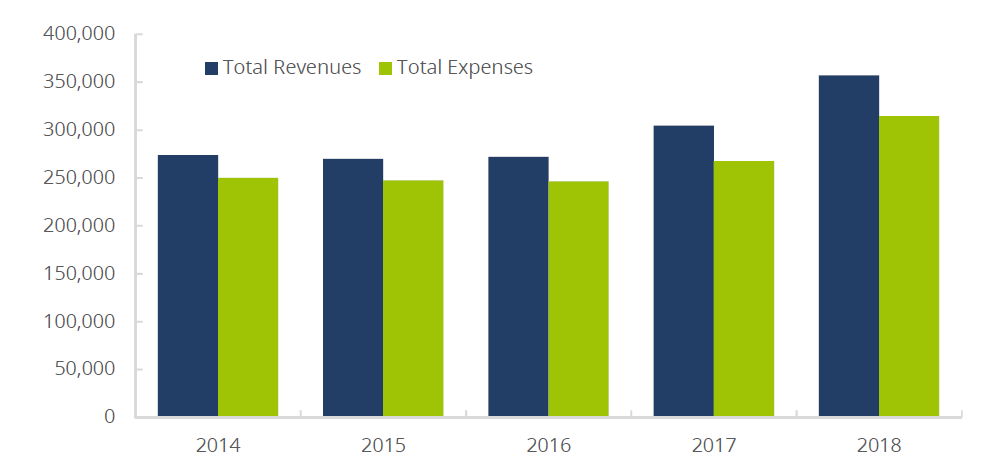
Source: Financial Industry Regulatory Authority
1Aggregated financial results only include firms that are FINRA-members as of year-end of each calendar year. Non-FINRA registered firms are not included.
FINRA-Registered Firms – Leaving/Entering the Industry, 2004 – 20181
(Count as of year-end)
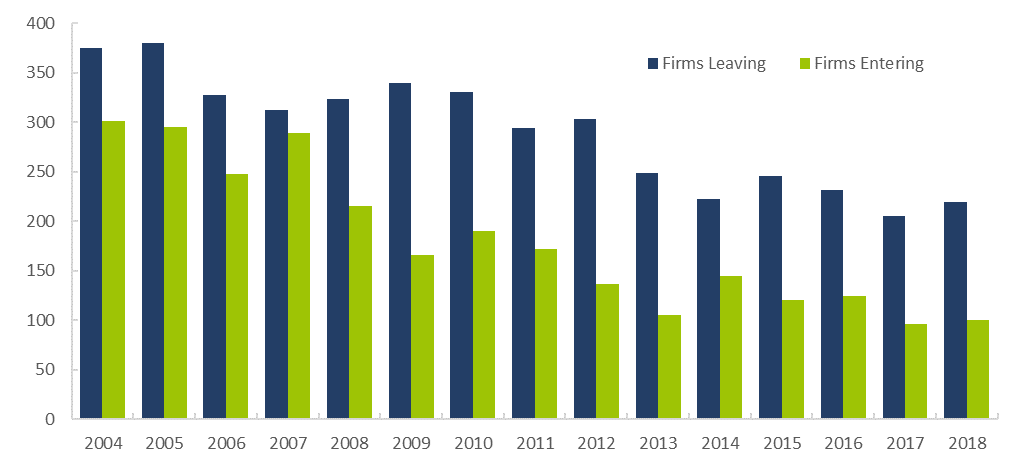
Source: Financial Industry Regulatory Authority
FINRA-Registered Firm Branch Offices – Opening/Closing, 2008 – 2018
(Count as of year-end)
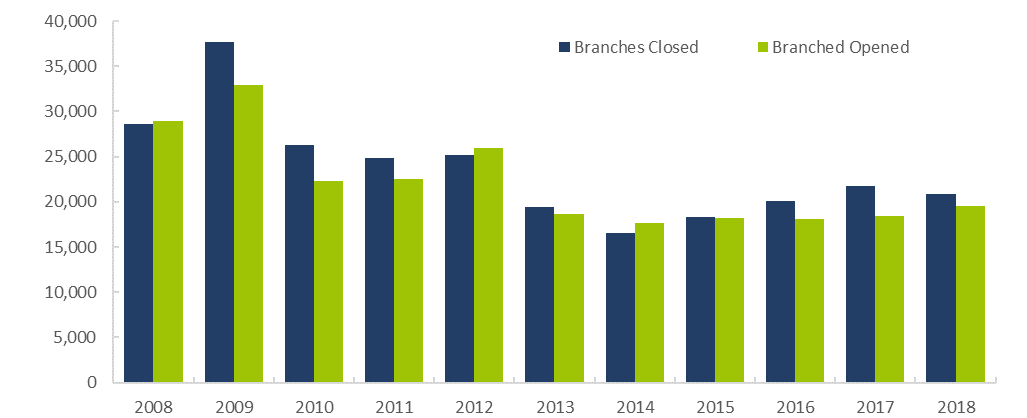
Source: Financial Industry Regulatory Authority
Spotlight: Capital Acquisition Brokers and Funding Portals, 2016 – 20181
(Count as of year-end)
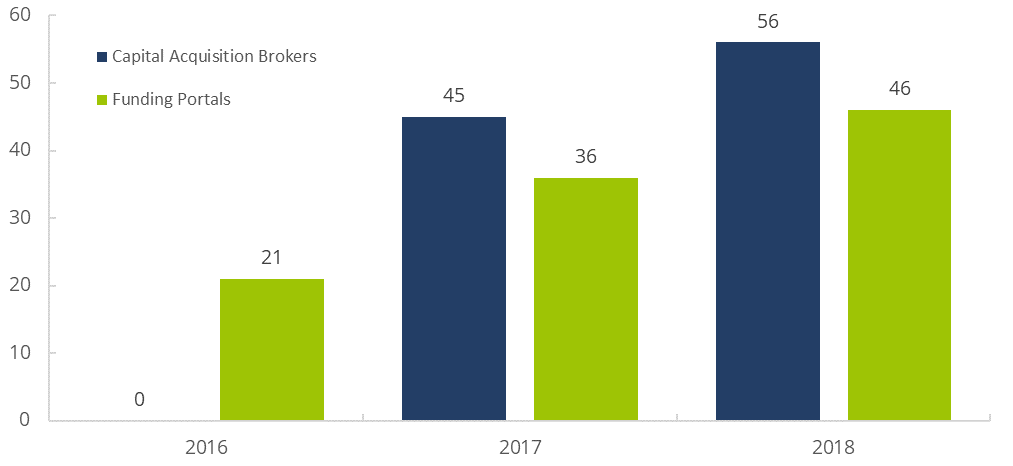
Source: Financial Industry Regulatory Authority
1Capital Acquisition Brokers (CABs) engage in limited range of activities, essentially advising companies and private equity funds on capital raising and corporate restructuring, and acting as a placement agent for sales of unregistered securities to institutional investors under limited conditions. The CAB rule took effect in 2017. Funding Portals (FPs) also engage in a limited range of activities: those prescribed under to JOBS Act and the SEC's Regulation Crowdfunding. The FP rule took effect in 2016.
FINRA Rule 2210 governs broker-dealers’ communications with the public, including communications with retail and institutional investors. The rule provides standards for the content, approval, recordkeeping and filing of communications with FINRA. FINRA’s Advertising Regulation Department reviews firms’ advertisements and other communications with the public to ensure they are fair, balanced, not misleading and comply with the standards of the SEC, MSRB, SIPC and FINRA advertising rules. FINRA rules do not require all communications to be filed, and the figures presented below therefore represent only a segment of such communication.
Advertising Regulation Filing Volumes, 2014 – 20181
(Count as of year-end)
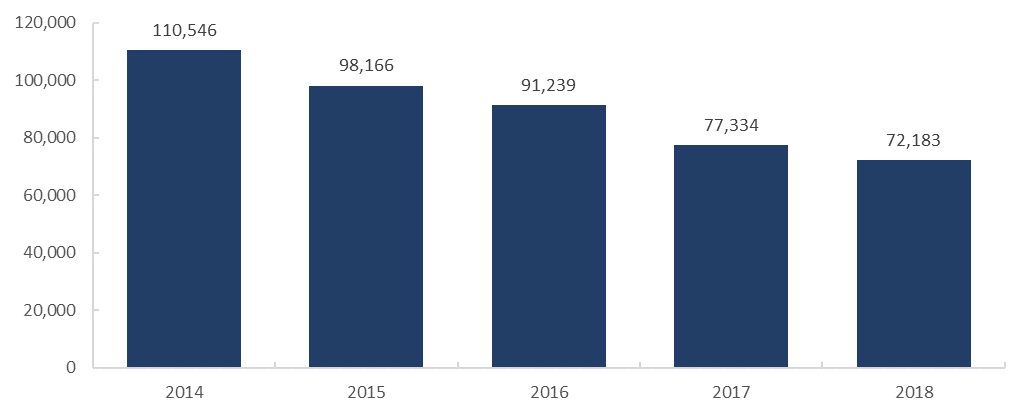
Source: Financial Industry Regulatory Authority
1Based on communications filed by broker-dealers for review by FINRA's Advertising Regulation Department ("Filings"). The filing requirements were modified in January 2017 as part of a retrospective review of the Communications with the Public Rules, as described in Regulatory Notice 16-41.
FINRA-Registered Firms – Most Common Marketing Methods Filed with FINRA, 2018
(Count as of year-end)
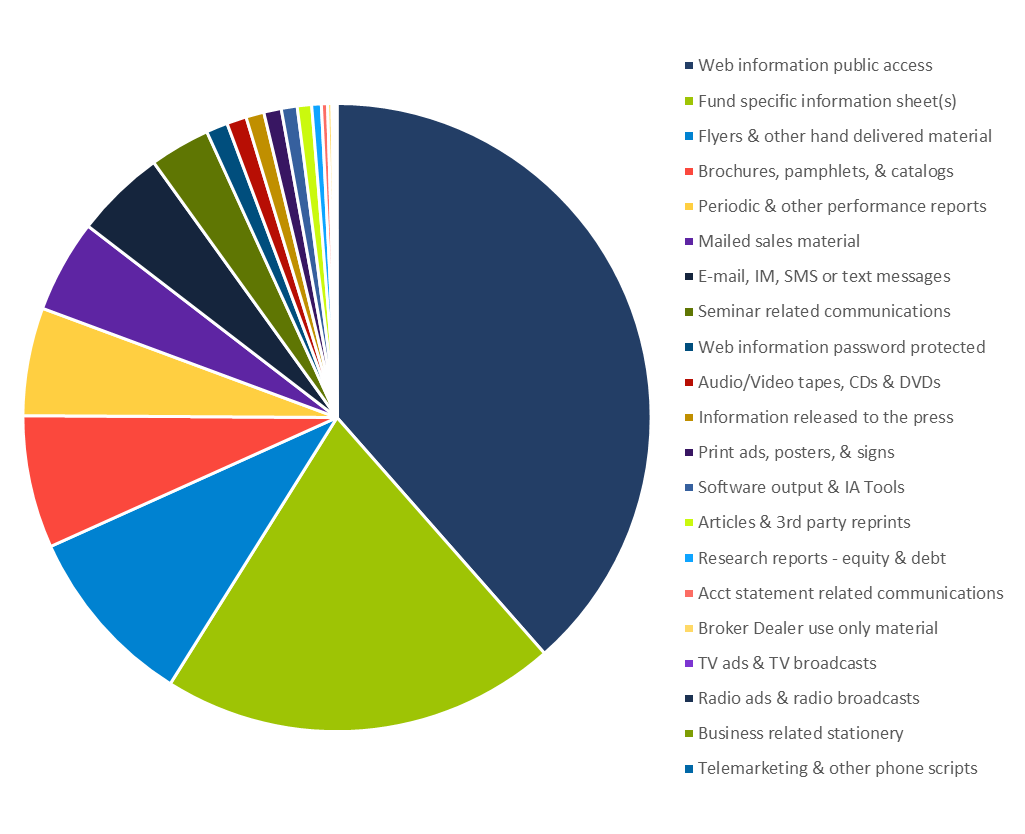
Source: Financial Industry Regulatory Authority
Advertising Regulation Filing Volumes – Investment Company Product, 2018
(Percentage of Total Filings)
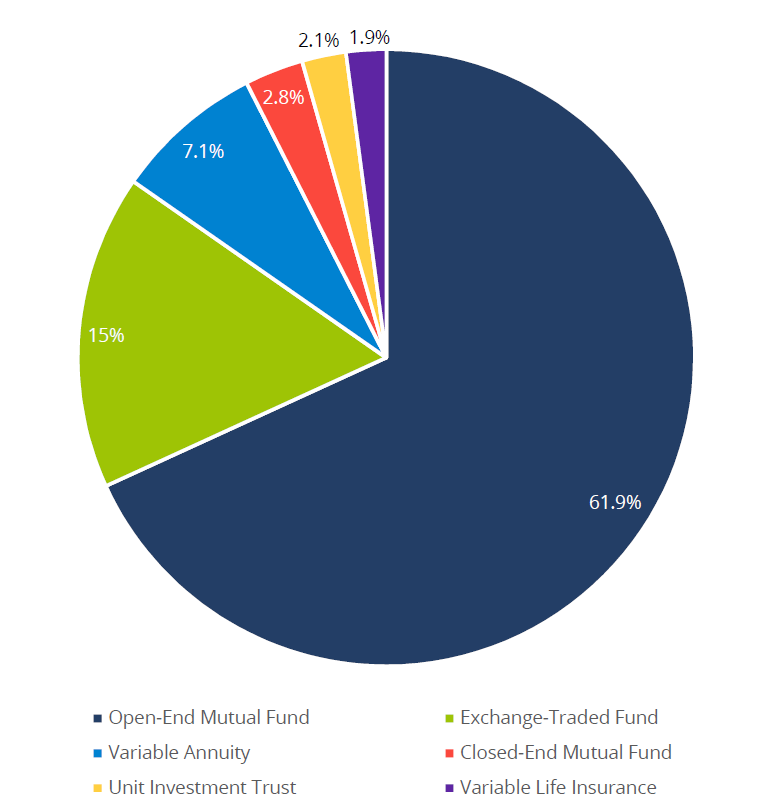
Source: Financial Industry Regulatory Authority